
Get the Latest
Torrance & Long Beach
Market Insights
Get Complete October 2025 Data Including
- median prices
- days on market
- inventory levels
- sold-to-list ratios
- 5-year price trends
- neighborhood breakdowns
What's Included in Your Free Report
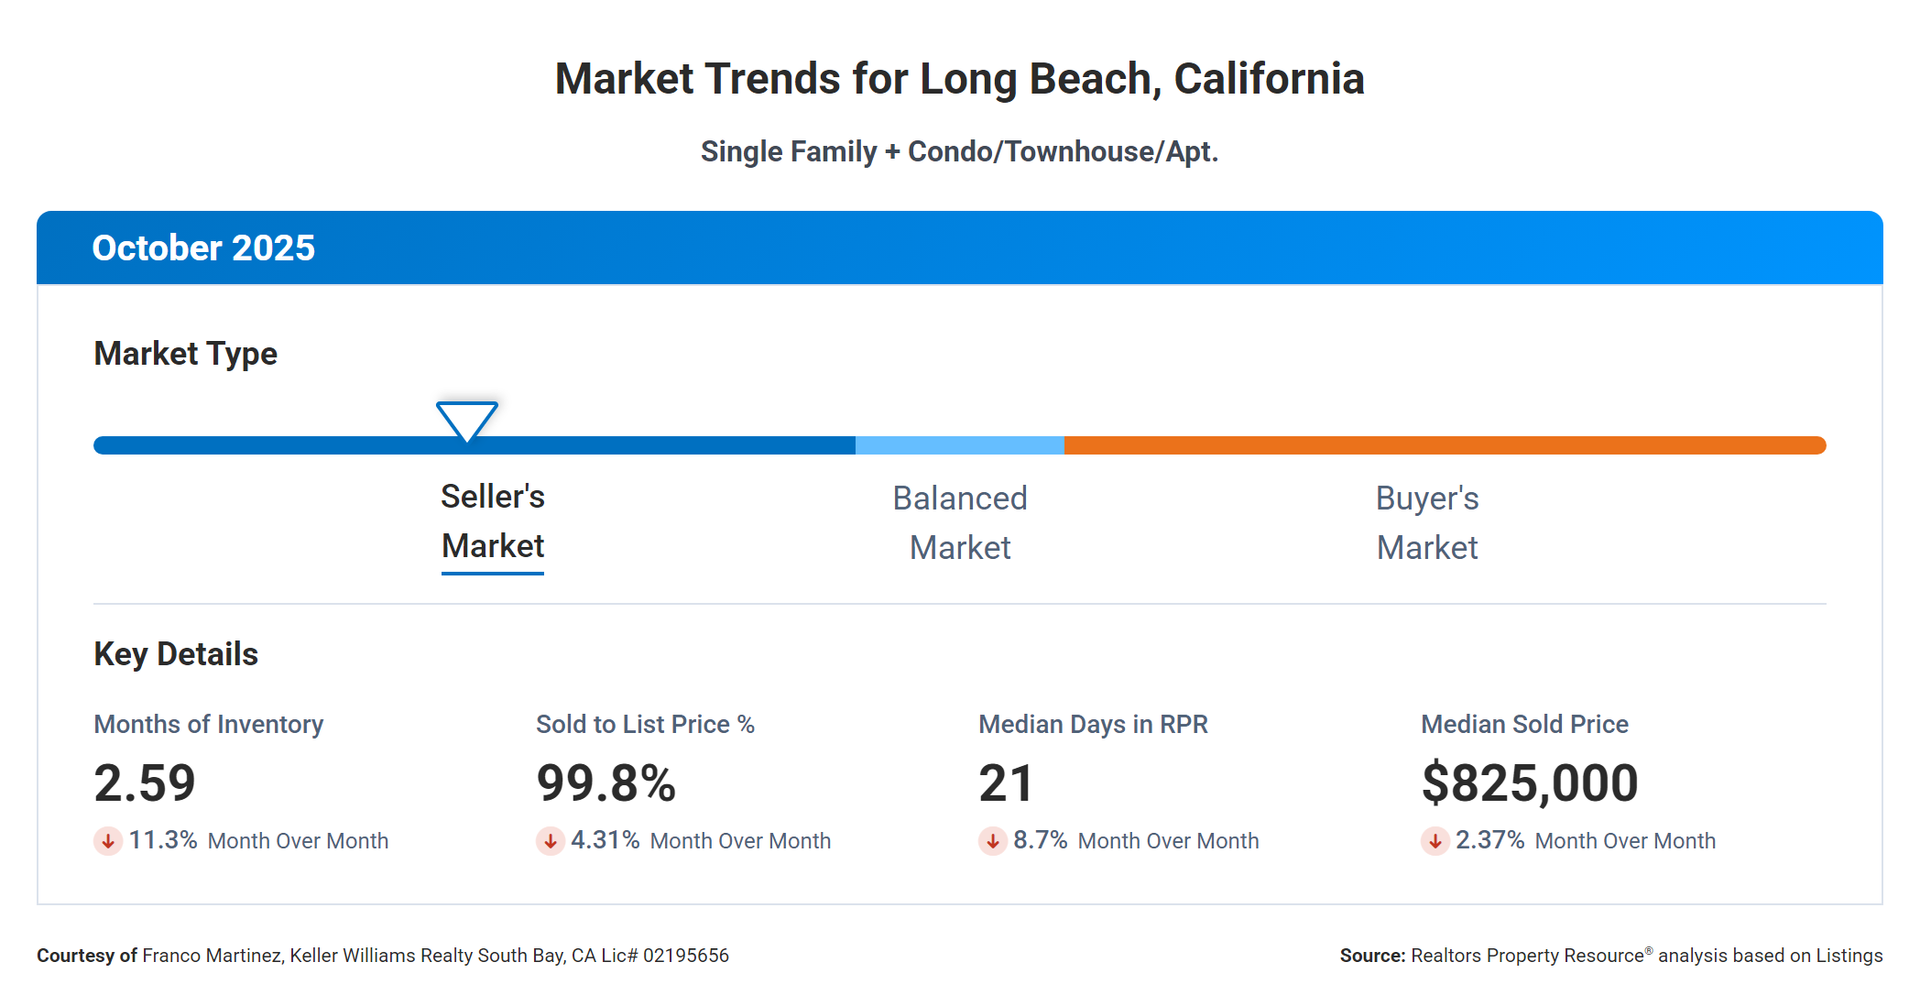
Median Sold Prices
Current median home prices for both Torrance and Long Beach, with month-over-month percentage changes to track market direction
Sold-to-List Price Ratio
Shows how close homes are selling to asking price, helping you set realistic expectations for offers
Months Supply of Inventory
Critical metric showing whether it's a buyer's or seller's market based on available homes versus demand
Active vs Sold Listings
12-month rolling data showing inventory levels and sales velocity to understand market momentum
5-Year Price Appreciation
Historical trends comparing Torrance and Long Beach to LA County and California averages, showing long-term investment potential
Neighborhood Analysis
Explore a curated list of local restaurants complete with ratings and discover nearby schools
Days on Market
Average time homes spend on the market before selling, indicating buyer demand and how quickly you need to act

